Peaks in pandas Time Series.
Intro#
When processing time series in pandas, I found it quite hard to find local minima and maxima within a DataFrame. Even when knowing the correct function from scipy, taking correct results is still hard. Doing it effeciently is even harder. I found a partially correct answer on stackoverflow and expand it here to provide the correct answer with examples.
Solution#
Data#
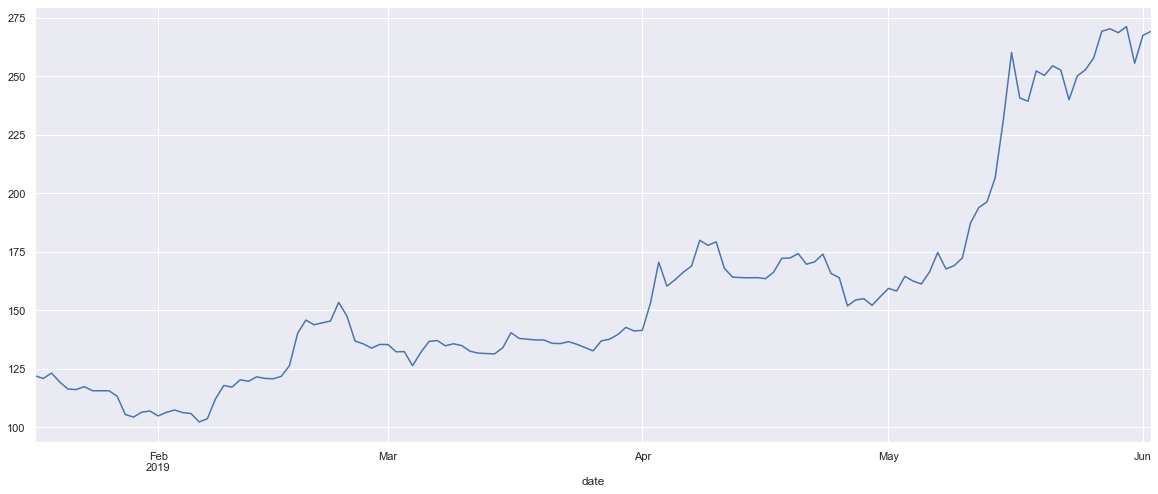
First we need data to work on. I am importing a historical set of ethereum transactions. To make things simple, I resample the DataFrame to daily set and leave only price column. Notice that you can parse dates on the fly when parsing the CSV, even with custom callback function. The next plot presents the data loaded.
import pandas as pd
import matplotlib.pyplot as plt
# This makes plots prettier
import seaborn; seaborn.set()
%matplotlib inline

import datetime
def dateparse (time_in_secs):
    return datetime.datetime.fromtimestamp(float(time_in_secs))

df = pd.read_csv('../csvs/ethusd.csv', index_col='date', parse_dates=True, date_parser=dateparse)
df = df.resample('D').mean()
df = df[['price']]
print(df.head(5))
                 price
date
2019-01-17  122.002639
2019-01-18  120.840360
2019-01-19  123.167901
2019-01-20  119.378474
2019-01-21  116.331089
df.price.plot(figsize=(20,8));
Finding indexes for extreams with scipy and argrelextrema#
Scipy provides a argrelextreama function that does a LOT of heavy lifting in this problem.
The actual implementation can be found here.
The result is an numpy array of indexes that are the peaks.
So in essence, argrelextreama returns ilocs of the DataFrame.
If you are fuzzy on what iloc means it is a Purely integer-location based indexing for selection by position.
In order to get prices that are the peaks you can use df.iloc function.
Note, that order in argrelextreama means a range from both sides.
We have daily data, so order=3 means +-3days - weekly peaks.
from scipy.signal import argrelextrema
import numpy as np
# first argument can a multidimentional np array as
# data : ndarray
# Array in which to find the relative extrema.
# This is reflected in what gets returned:
#Returns
# -------
# extrema : ndarray
# Boolean array of the same shape
# That is why at the end of the line we just take the first element
# order: How many points on each side to use for the comparison to consider
ilocs_min = argrelextrema(df.price.values, np.less_equal, order=3)[0]
ilocs_max = argrelextrema(df.price.values, np.greater_equal, order=3)[0]
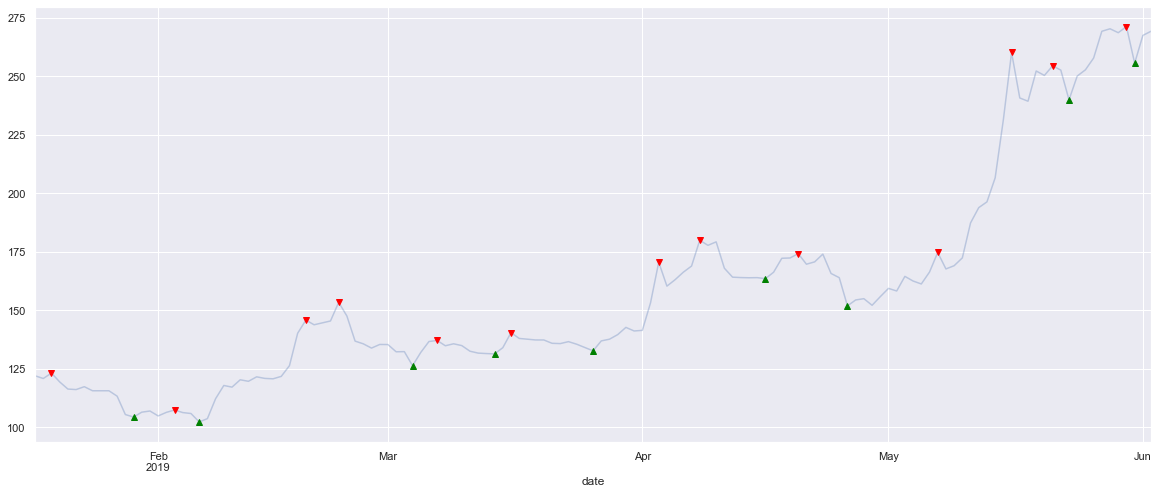
df.price.plot(figsize=(20,8), alpha=.3)
# filter prices that are peaks and plot them differently to be visable on the plot
df.iloc[ilocs_max].price.plot(style='.', lw=10, color='red', marker="v");
df.iloc[ilocs_min].price.plot(style='.', lw=10, color='green', marker="^");
How to update DataFrame with found peaks#
Now that we know how to get the peaks in the time series, it is time to learn how to include the results in the DataFrame.
The naive approach would be to use iloc and combine with filtering.
It would be not only very slow (for bigger datasets) but also would not work.
Snippet bellow shows that approach.
Notice that, you get a warning, but no errors nor exceptions.
# http://pandas.pydata.org/pandas-docs/stable/user_guide/indexing.html
df['weekly_max'] = False
df['weekly_min'] = False
df.iloc[ilocs_min]['weekly_min'] = True
df.iloc[ilocs_max]['weekly_max'] = True
# this will return empty DataFrame, which is not what we wanted.
print(df[df['weekly_min'] == True])
Empty DataFrame
Columns: [price, weekly_max, weekly_min]
Index: []


/Users/ed/.local/share/virtualenvs/data-saE_DZ1J/lib/python3.6/site-packages/ipykernel_launcher.py:4: SettingWithCopyWarning:
A value is trying to be set on a copy of a slice from a DataFrame.
Try using .loc[row_indexer,col_indexer] = value instead

See the caveats in the documentation: http://pandas.pydata.org/pandas-docs/stable/indexing.html#indexing-view-versus-copy
  after removing the cwd from sys.path.
/Users/ed/.local/share/virtualenvs/data-saE_DZ1J/lib/python3.6/site-packages/ipykernel_launcher.py:5: SettingWithCopyWarning:
A value is trying to be set on a copy of a slice from a DataFrame.
Try using .loc[row_indexer,col_indexer] = value instead

See the caveats in the documentation: http://pandas.pydata.org/pandas-docs/stable/indexing.html#indexing-view-versus-copy
  """
The warning is quite verbose.
The key here is: A value is trying to be set on a copy of a slice from a DataFrame..
Good explanation of this can be found on stackoverflow and pandas documentation.
Warning suggests using .loc[row_indexer,col_indexer] = value, which is what is shown in the snippet bellow.
Note, that row_indexer means an index. To transform list of ilocs to the index, use: df.iloc[ilocs_min].index.
df['weekly_max'] = False
df['weekly_min'] = False
df.loc[df.iloc[ilocs_min].index, 'weekly_min'] = True
df.loc[df.iloc[ilocs_max].index, 'weekly_max'] = True
# display prices that are minimums and maximums
print(df[df['weekly_min'] | df['weekly_max']])
df.price.plot(figsize=(20,8), alpha=.3)
df[df['weekly_max']].price.plot(style='.', lw=10, color='red', marker="v");
df[df['weekly_min']].price.plot(style='.', lw=10, color='green', marker="^");
                 price  weekly_max  weekly_min
date
2019-01-19  123.167901        True       False
2019-01-29  104.371118       False        True
2019-02-03  107.372949        True       False
2019-02-06  102.280320       False        True
2019-02-19  145.809688        True       False
2019-02-23  153.401689        True       False
2019-03-04  126.320644       False        True
2019-03-07  137.093550        True       False
2019-03-14  131.361888       False        True
2019-03-16  140.445883        True       False
2019-03-26  132.669041       False        True
2019-04-03  170.548572        True       False
2019-04-08  179.932684        True       False
2019-04-16  163.505072       False        True
2019-04-20  174.206577        True       False
2019-04-26  151.879252       False        True
2019-05-07  174.703111        True       False
2019-05-16  260.186439        True       False
2019-05-21  254.475075        True       False
2019-05-23  239.937994       False        True
2019-05-30  271.248413        True       False
2019-05-31  255.605779       False        True
Plot generated from updated DataFrame is the same as the one created by df.iloc[ilocs_max].price.plot(). This is a good confirmation that DataFrame has been updated properly.

I hope it helped you and saved you some time. Cheers!